[NEW] Our Product Recap for Q2 2025 is live.
Learn more


.svg)
EquityList Team
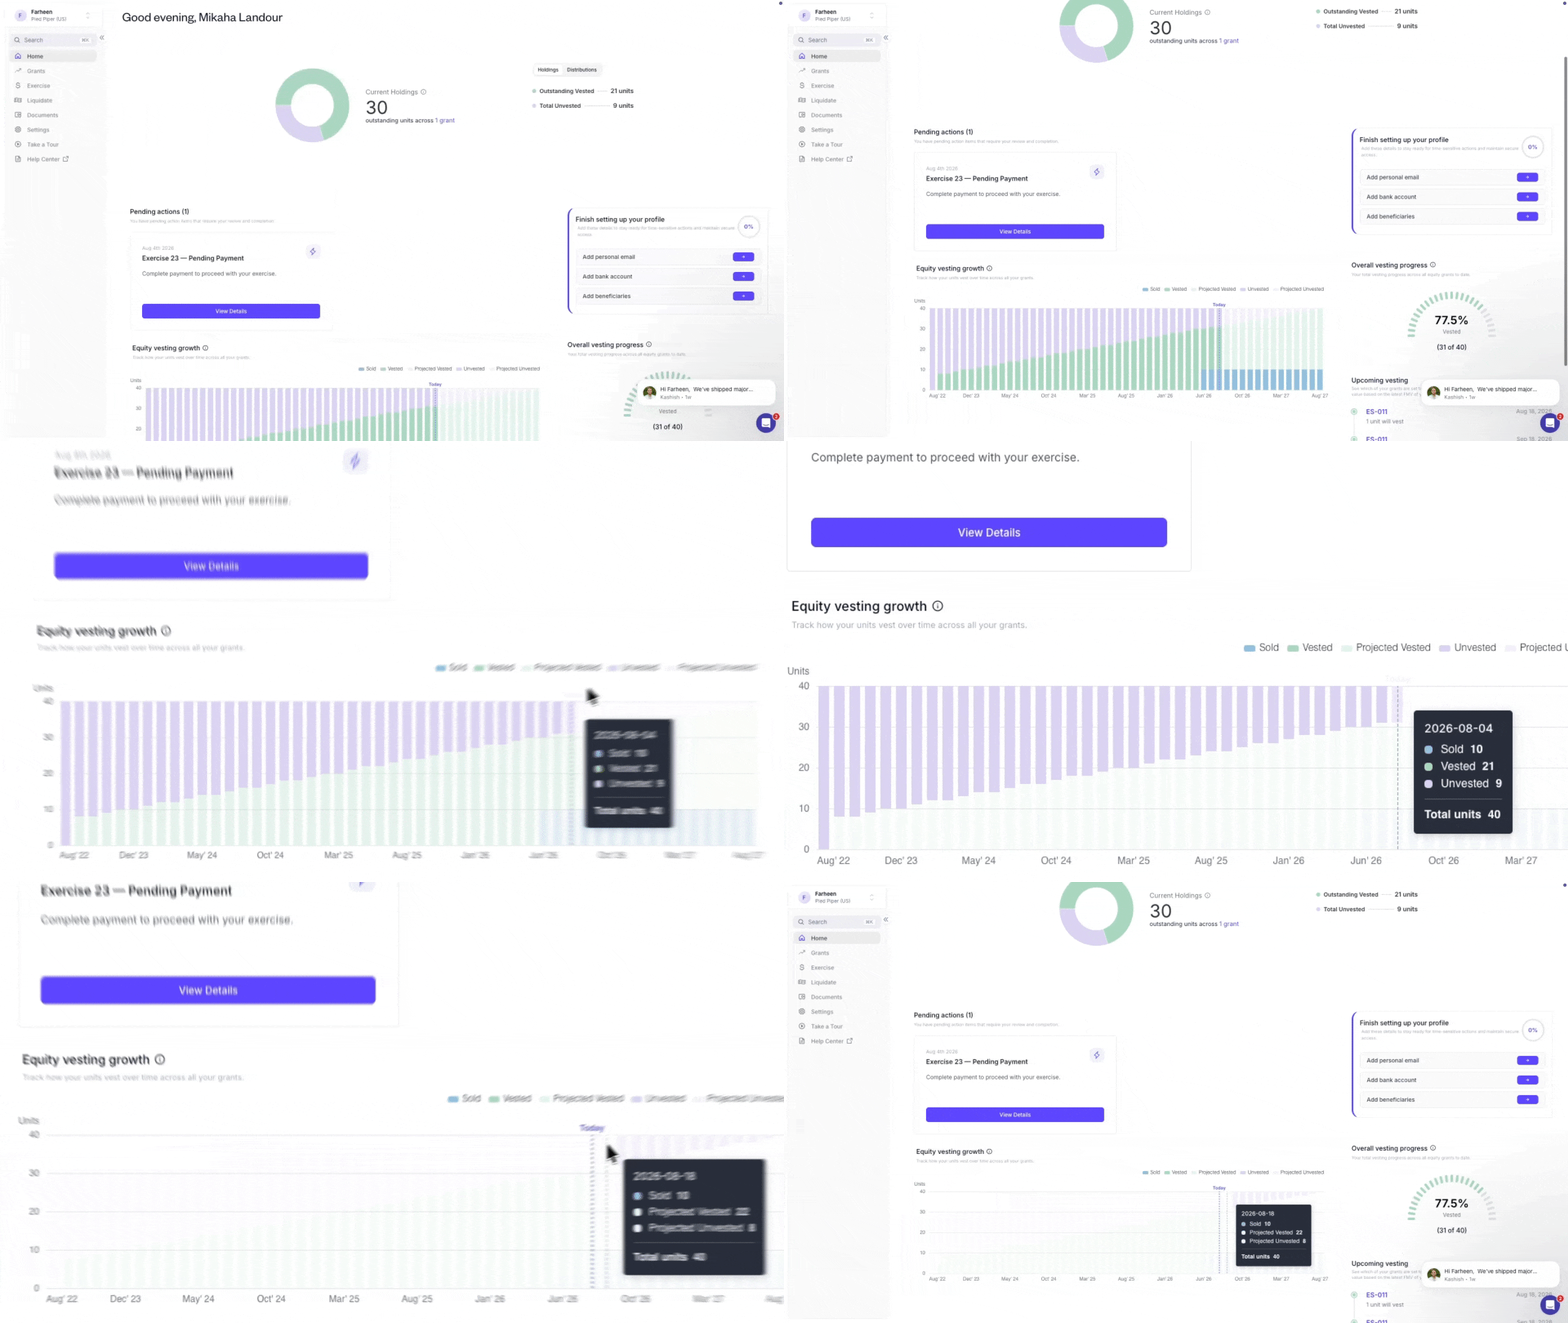
On the Stakeholder Dashboard, the Equity Vesting Growth chart is now a stacked bar graph that clearly separates vested, unvested, exercised, and surrendered equity instead of one blended line.
Vested and unvested values move with the market — updating dynamically as FMV changes — while exercised and surrendered values stay locked to the FMV on their event date, so past transactions never shift after the fact. Hover anywhere on the chart for the full breakdown.

.svg)

.svg)